Features

Powerful optimization functionality at the tips of your fingers

As an implementation specialist or operations researcher you ensure that the data objects interface and customer-specialist rules are implemented. Your job is demanding enough without having to waste time dealing with OS-dependent tools. We have the answer. Focus on your core duties and leave the rest to the More Optimal platform.

More-Optimal-Product-3
Cloud-platform

Cloud hosted

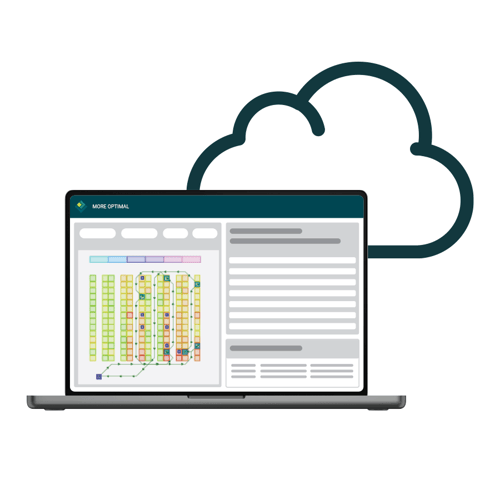
The More Optimal platform is hosted in the cloud. Model your supply chain applications in your browser and allow your end users to contribute as well. Take advantage of smart algorithms and powerful visualization… what you see is what you get!

Platform features

IconCalculation engine

Calculation engine

The engine allows you to focus on your computations. Dependencies between calculated fields are automatically handled by the platform.
IconFlexible interfacing

Flexible interfacing

More Optimal provides extremely flexible interface configurations with external systems. It is also seamlessly integrated with Excel.
IconLowcode

Low-code

Supply chain modeling requires no code. You create specific calculations and visualizations using minimal and easy to understand code.
IconOptimization

Optimization

Our powerful algorithmic building blocks are fully integrated in the platform and can be used out of the box.
IconReporting

Reporting

As a planner and modeler, gain even deeper insight into your data. The More Optimal platform provides rapid ad hoc reporting on all of your available data.
IconScalability

Limitless scalability

Serverless scaling allows you to run multiple algorithms in parallel. This ensures you can solve all of your supply chain conundrums, no matter how immense the scale.
IconVisuals

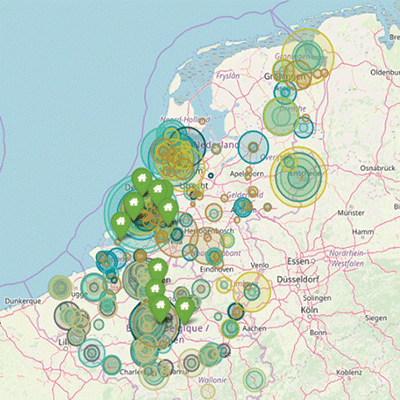
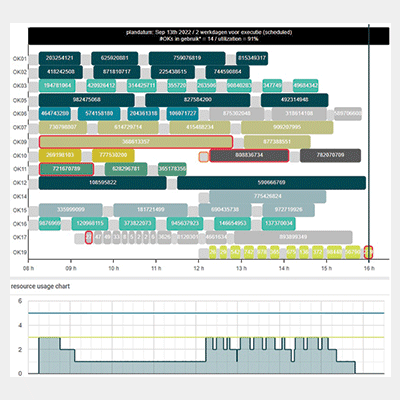
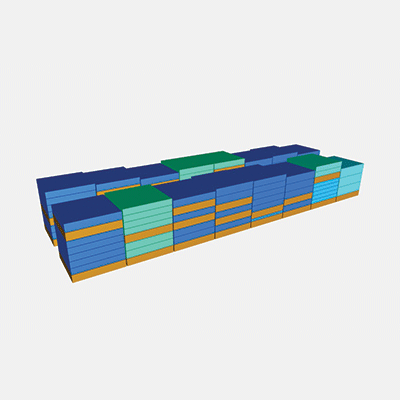
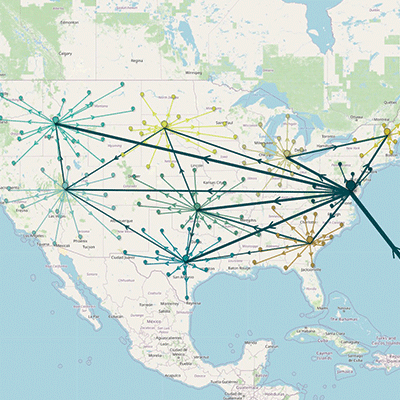
Powerful visuals

Use maps, 3d visuals, and Gantt and other charts out of the box. As a modeler, you only need low-code to easily configure these charts and create custom visuals. And benefit and share these low-code solutions with other modelers in the More Optimal community.
IconWysiwyg

WYSIWYG

Adjust planning logic and algorithms in the browser where they are used and immediately see the consequence of your changes in the user interface.

Data visualization examples
Features_0004_warehousing_layout-optimization

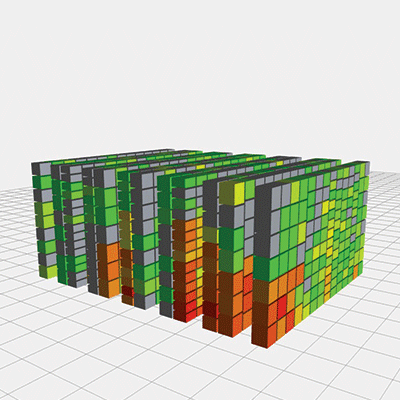
Layout optimization

Features_0016_field-services_resource-allocation

Resource allocation

Features_0015_healthcare_OR-schedule

Workforce scheduling

Features_0008_transport-planning_load-optimization

Load optimization

Features_0002_warehousing_network-planning

Network planning

Features_0012_manufacturing_detailed-batching

Detailed batching

More-Optimal-Engineer-2

Low-code platform enabling stable and quick results

Configure customer specific rules directly in your browser. You only need to use low-code (based on a small subset of JavaScript) and often no code at all. You can also configure powerful optimization and visualization features to use customer data in a matter of hours instead of days or weeks. And applications are deployment-ready in weeks instead of months.

Get in touch

Our experts are here to help you out.