

Features
Powerful optimization functionality at the tips of your fingers
As an implementation specialist or operations researcher you ensure that the data objects interface and customer-specialist rules are implemented. Your job is demanding enough without having to waste time dealing with OS-dependent tools. We have the answer. Focus on your core duties and leave the rest to the More Optimal platform.

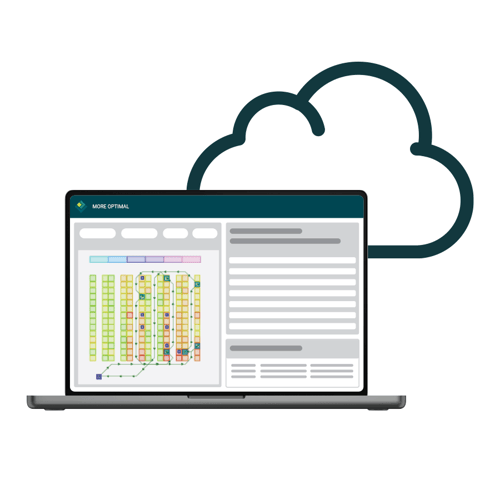
Cloud hosted
The More Optimal platform is hosted in the cloud. Model your supply chain applications in your browser and allow your end users to contribute as well. Take advantage of smart algorithms and powerful visualization… what you see is what you get!
Platform features
Calculation engine
Flexible interfacing
Low-code
Optimization
Reporting
Limitless scalability
Powerful visuals
WYSIWYG
Adjust planning logic and algorithms in the browser where they are used and immediately see the consequence of your changes in the user interface.
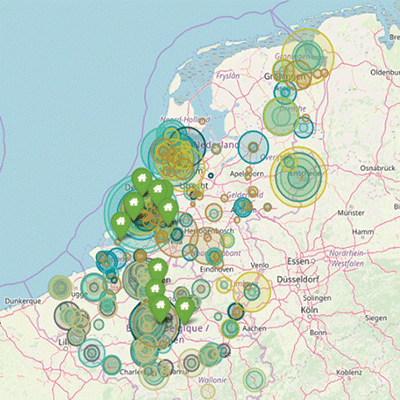
Data visualization examples
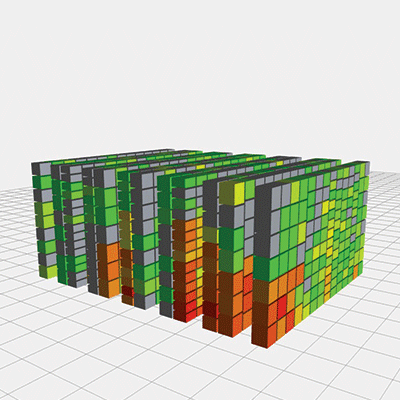
Layout optimization
Resource allocation
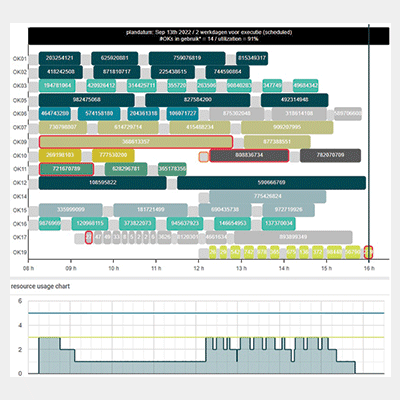
Workforce scheduling
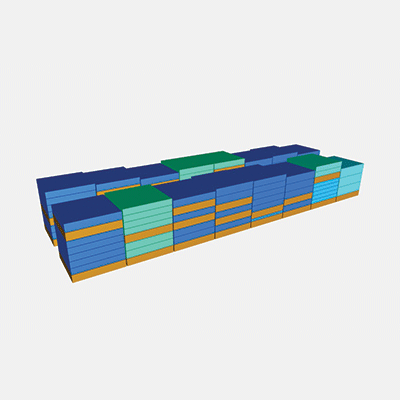
Load optimization
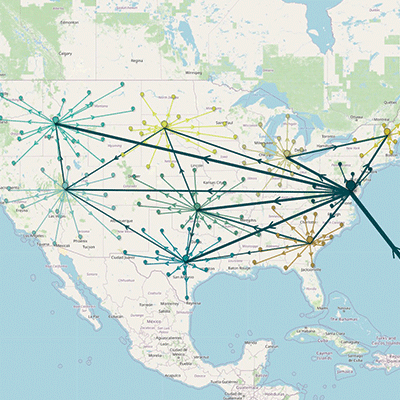
Network planning
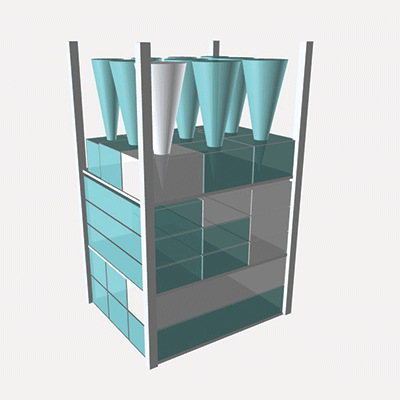
Detailed batching

Low-code platform enabling stable and quick results
Configure customer specific rules directly in your browser. You only need to use low-code (based on a small subset of JavaScript) and often no code at all. You can also configure powerful optimization and visualization features to use customer data in a matter of hours instead of days or weeks. And applications are deployment-ready in weeks instead of months.
